The following Feasibility Analysis was released this evening and is being published in full below. This 3rd-party study is a required hurdle that must be passed before being considered by the GA state legislature. Read an analysis by our News Editor John Ruch here.
The report concludes that:
Based on our analysis, we find estimated revenues of $203.5 million exceed likely expenditures for the services identified to be provided, estimated at $89.8 million, and therefore have concluded that the City of Buckhead is likely fiscally feasible.
Valdosta State University is a Regional Comprehensive University within the University System of Georgia. As a comprehensive university, VSU provides educational programs across the State of Georgia and around the world via on-line programs and course offerings while placing a special focus on the University’s 41- county service region. The seven colleges within the University are the College of Science & Mathematics, the College of Humanities & Social Sciences, the Langdale College of Business Administration, the Dewar College of Education & Human Services, the College of the Arts, the College of Nursing & Health Sciences, and the Honors College. VSU offers five associate programs, fifty-eight bachelor programs, forty-two master programs, and seven doctoral programs. In 2021, the Commission on Colleges of the Southern Association of Colleges and Schools reaffirmed VSU’s regional accreditation as a part of its 10-year review process with no findings or recommendations.
The Valdosta State University Center for South Georgia Regional Impact was established in 2018 to partner with community leaders, county and municipal officials, education leaders, healthcare providers, and the business community to identify broad as well as localized issues that can be addressed through the combined interdisciplinary expertise of VSU’s highly accomplished faculty, talented staff, and vibrant student body. To date, the Center has engaged in over 130 projects and Executive Director Darrell Moore has testified before the United States House of Representatives Committee on Oversight & Reform on the Center’s work on the 2020 Census.
The Georgia House of Representatives Governmental Affairs Committee requires legislation proposing incorporation to have a corresponding feasibility study conducted before said legislation may be considered. The Committee recently modified its rules to allow any qualified University System of Georgia Institution to conduct the study. Valdosta State University meets the Committee’s criteria as a qualified institution having conducted financial impact studies, feasibility studies, and other related peer- reviewed research projects led by highly qualified, terminally degreed faculty, staff members with high levels of experience and expertise, and closely supervised graduate and undergraduate students.
2
This feasibility study is intended to provide members of the House Governmental Affairs Committee, members of the General Assembly, and the public with accurate information to assist in the exploration of the fiscal feasibility of a new municipality. The main purpose of the analysis is to estimate the ability of a proposed municipality to meet financial obligations with available revenues.
This study provides detailed revenue and expenditure estimates for a proposed Buckhead City. To reach reasoned conclusions regarding anticipated fiscal impact, a thorough examination of budget documents from the cities of Atlanta, Sandy Springs, South Fulton, and Roswell, as well as Fulton County was conducted. Interviews were conducted with individuals at related institutions and governments, in addition, state and local statutes were consulted.
The proposed Buckhead City should expect annual revenue of approximately $203,521,892 and annual expenses of approximately $89,921,825 (these represent conservative estimates for revenue and a high estimate for expenditures, see Table 1). Based on budget projections, Buckhead City would realize a surplus of $113,600,067 under current property valuations and applicable millage rates. Subsequently, Buckhead City could offer property owners a significant reduction in property taxes, enhanced and/or new services for city residents, or a combination thereof.
Based on these estimates and given the assumptions that are detailed in this report, we have concluded that a proposed Buckhead City would be financially feasible.
TABLE 1. Summary of
ESTIMATED REVENUES AND EXPENDITURES
| Study Area | |
| Total Revenues | $203,521,892 |
| Total Expenditures | $89,921,825 |
| Surplus (Deficit) | $113,600,067 |
The Center for South Georgia Regional Impact (CSGRI), at Valdosta State University responded to a request for proposal (RFP), and was selected to develop an analysis of the fiscal feasibility of the proposed Buckhead City. The purpose of the analysis is to estimate the ability of the study area to meet its expenditures with available revenue sources. This report provides estimates of revenues and expenditures that a potential Buckhead City, if incorporated, could anticipate in providing certain municipal services for a single fiscal year. To determine the estimates for the proposed city, we examined budget documents from the Cities of Atlanta, Sandy Springs, Roswell, Brookhaven, South Fulton and Fulton County. We also spoke with individuals at related institutions and governments and researched current legislation at the state and local level.
Sandy Springs and Roswell were selected at the outset of the study to be used as the comparisons for expenditure purposes. These cities are similar in size to the study area and are located in metropolitan Atlanta. In most cases, the fiscal years of 2020 and 2021 were used from each city to estimate costs, because they constituted the best available data during the time the study was conducted. In some cases data was pulled from prior years when considered the best available information.
Information from the Fulton County Tax Assessor’s Office, Department of Community Affairs (DCA) Report of Local Government Finances, and the May 2020 DCA Uniform Chart of Accounts (ATTACHMENT A) were used as the primary sources to identify potential revenue streams. CSGRI
built a Geographic Information Systems (GIS) database containing tax parcel data and Census data for Fulton County, Georgia. Tax Parcel Data was retrieved from the Fulton County GIS Portal (gisdata.fultoncountyga.gov). Data was opened with QGIS 3.20.1 and analyzed to obtain parcel count and assessed value for the City of Atlanta and for the Study Area provided by the General Assembly’s Reapportionment Office. To obtain tax data for Atlanta, the parcel data was exported from QGIS to Excel and filtered by Tax District to extract parcels for the City of Atlanta, which had over 154,000 parcels with an assessed value of $37.65 billion. Parcel data was then filtered in QGIS by parcels located within the boundary of the study area that was provided and then exported to Excel.
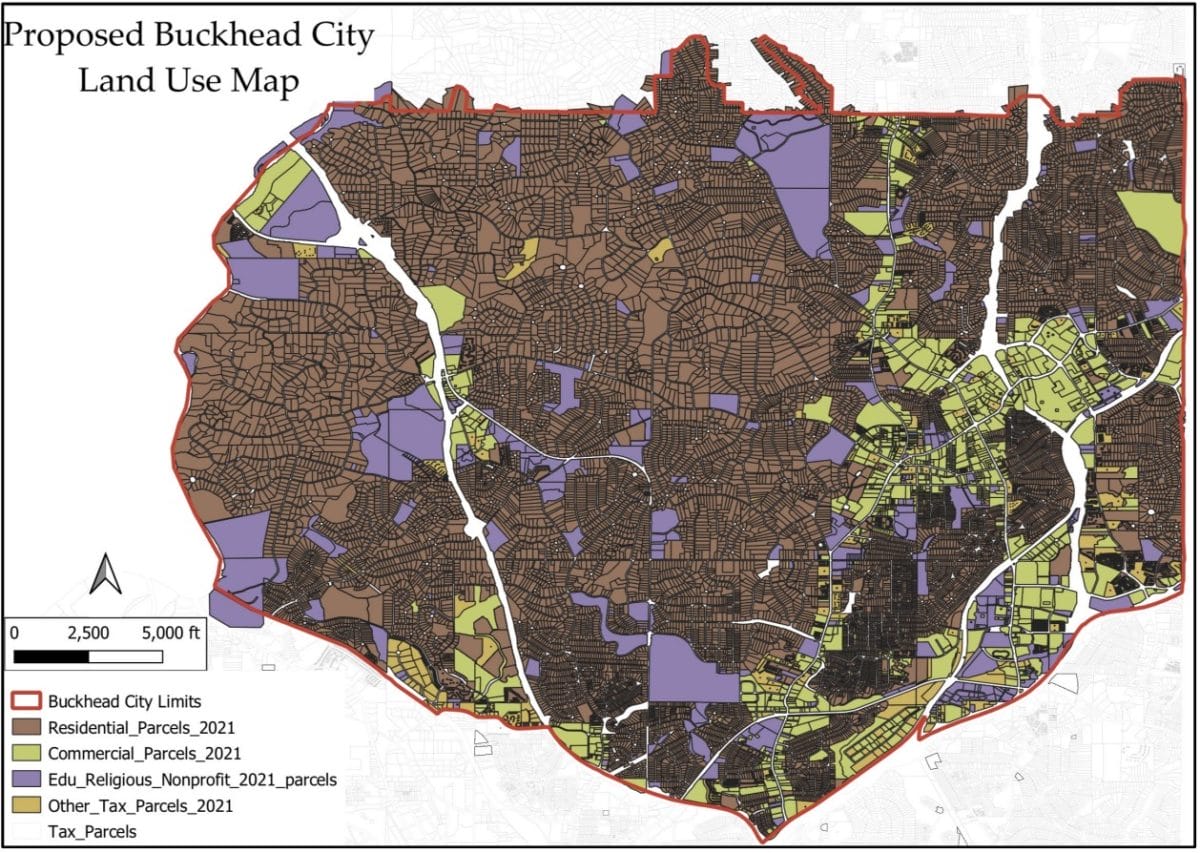
Figure 1 provides a geographic overview of the composition of study area land use by land use category. The study area land use is predominantly residential by surface area, with concentrated pockets of commercial area, and areas owned by religious groups (with many of those larger areas containing schools or healthcare facilities operated by those organizations).
Estimates provided in this report are based on actual tax revenues and actual service levels for a city not yet created, and will be determined by the newly founded city government. The methodology is research driven and fact based using publicly available and government collected data. While it is our hope that this report assists with the public consideration of the proposed Buckhead City, Valdosta State University has no opinion for or against the proposed cityhood issue.
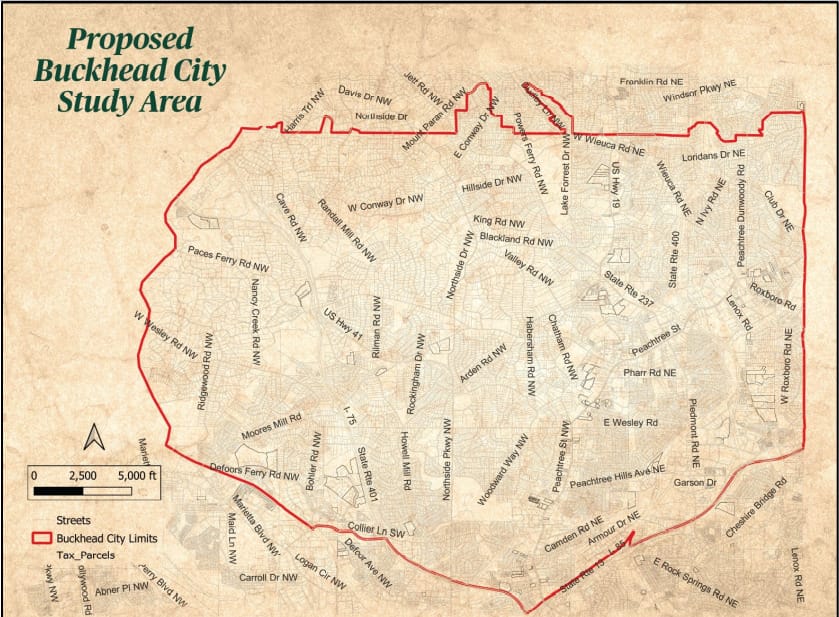
This study used a specific geographic boundary to derive many of the data inputs related to population, property and business activities that form the basis of revenue assumptions and the City services that compose estimated expenditures. The Buckhead City Study Area in this report utilizes the boundaries established by the Buckhead City Committee (formally known as the Buckhead Exploratory Committee) and referenced in House Bill 854 in the 2021-2022 Regular Session of the Georgia state Legislature.

The study area depicted in Figure 2 is 16,066 acres or roughly 25 square miles. The Southernmost point starts at the I75/I85 “Brookwood” split. Northwestwardly and clockwise from that point along I75 to Collier Road. West along Collier Rd to the Railroad just past Hills Ave NW and continuing along the rail tracks west to the Chattahoochee River. West line is up the Chattahoochee River to the Sandy Springs line. Top north line is Sandy Springs from the river to the DeKalb County line. East line is the DeKalb County & Brookhaven City line running south to I85, returning southwest along I85 to the starting point.
The study area has a population of 103,867 based on recently published 2020 US Census data. More detail on how the parcel data and population data was derived for the study area is available in Appendix A and B.
The following table provides additional context for the study area’s relative scale to the City of Atlanta as it exists today. The study area represents roughly 1/5 of the City of Atlanta by population, number of parcels, and total land area. Many revenue estimates in this study reference the per capita ratio of City of Atlanta revenue streams as this ratio would be expected to yield the most conservative output of the three ratios shown below.
| City of Atlanta | Study Area | Study Area as % of City of Atlanta | |
| Parcels | 154,177 | 34,217 | 22.1% |
| Land Area | 67,949 | 16,066 | 23.6% |
| Population (2020) | 498,715 | 103,867 | 20.8% |
The revenue estimates outlined below include all major revenue sources a city representing the study area would have collected had it existed in 2020-2021, and assessed taxes and fees at rates similar to the City of Atlanta in that same period (ATTACHMENT B – Atlanta 2020 RGLF). The revenue analysis is based on revenue collections by Fulton County in 2020, property data for Fulton County, and revenues reported in the City of Atlanta’s 2020 Comprehensive Annual Financial Report (CAFR) (ATTACHMENT C). The analysis includes common revenue streams that are available to local municipalities by Georgia Code.
Some revenue estimates also assume potential negotiations for future tax revenues with Fulton County and other municipalities. We used the most recently available data in order to estimate potential revenue for the area under study. In calculating these estimates, we applied metrics used in prior research that were accepted by stakeholders in some of the most recent incorporation feasibility studies. Thus, the report uses similar revenue estimation methodologies as those provided in CVIOG’s 2018 report, “Fiscal Feasibility Analysis of a Proposed City of Vista Grove”, and CVIOG’s 2017 report “Stockbridge De-Annexation Fiscal Analysis” to the extent possible.
For revenue projections that do not have a defined process to estimate income, we extrapolated the 2020 Atlanta revenue on a per capita or similar basis for the study (Per capita estimate).
In order to estimate the study area’s share of potential revenue, the total revenue was divided by the estimated share of the study area’s population, relative to the City of Atlanta as a whole.
| Calculation of Study Area’s Per Capita Estimate | ||
| Population Study Area (2020) | 103,867 | |
| City of Atlanta Population (2020) | 498,715 | |
| Study Area Population Share (2020) | 20.83% |
Ad valorem taxes levied on an assessed valuation of real and/or personal
property. (Ga. Const., Art VII, §1, para 3; Ga. Const., Art VII, §2; Ga. Const., Art IX, §4; OCGA §48-5-2; §48- 5-7.1—7.5; §48-5-40—56; §48-5-56; §48-5-273; §48-5-359.1; §48-6-1}
| 31.1100 – Real Property – Current Year (Land, buildings, permanent fixtures, and improvements due in the current year). Estimated based on Fulton County Tax Parcel Data retrieved from the Fulton County GIS Portal and selected to include parcels within the Buckhead City Study Area Boundary. | Total 2021 Assessed Value of parcels from the Fulton County Tax Assessors for the study area is ($15,241,069,410). The current city of Atlanta millage rate for 2021 is 7.85 mills (Expressed as 0.00785). | $119,642,391 |
| 31.1110 – Public Utility (OCGA §48-5-510—524) Each report shall be itemized by public utility and by parcel of real property or type of personal property returned and shall specify clearly the value returned by the utility for each parcel of real property or type of personal property together with any change as to value made by the commissioner, by the State Board of Equalization or, where appropriate, by both.) Estimated from the City of Atlanta Report of Local Government Finances for the year ending June 30, 2020. Since no Utility Franchise Tax (31.1700) was reported in FY 2020 RLGF, yet the City’s 2020 Comprehensive Annual Financial Report (CAFR) reported $43.3 million in Public Utilities Franchise Taxes, we assume that franchise taxes and other revenue streams have been reported along with utility property taxes as 31.1110 Public Utility Property Taxes (ATTACHMENT D) | Per Capita Estimate 2020 Atlanta Revenue $111,600,000 x 20.83% The total for 31.1110 most likely includes additional revenue streams that were included in Atlanta’s 2020 Annual Financial Report, but were not listed in the 2020 RGLF. For consistency, we utilized the amount provided and noted the process in other line items (Franchise fees for utilities and intangible taxes). | $23,246,280 |
9
| 31.1310 – Personal Property Tax – Motor Vehicle (Levied on motor vehicle personal property.) | Per Capita Estimate 2020 Atlanta Revenue $743,000 x 20.83% | $154,767 |
| 31.1315 – Personal Property Tax – Motor Vehicle Title Ad Valorem Tax Fee (TAVT) (OCGA §48-5C-1) Effective March 1, 2013 title ad valorem tax fee revenue will be received when a vehicle is purchased and/or titled in Georgia. Motor vehicles are subject to an ad valorem tax levied on their assessed value. The figure above is derived by applying the population ratio and assumes car ownership is consistent across the unincorporated area. Motor vehicles purchased and titled in Georgia prior to March 1, 2013 are generally subject to annual ad valorem taxes pursuant to Chapter 5 of Title 48. Vehicles purchased on or after March 1, 2013 are subject to TAVT and are exempt from annual ad valorem tax. Thus, as Georgia taxpayers purchase new motor vehicles, the annual ad valorem tax revenue collected will decrease gradually each year. The first step distribution of TAVT proceeds is calculated by comparing the 2012 annual ad valorem taxes collected in a given month to the amount collected in the same month of the current year. For a “new city” which collected no annual ad valorem tax in a given month during 2012, there is no figure or record available upon which to compare subsequent year annual ad valorem tax revenue. Thus, the reduction offset amount will always be zero, and the first step distribution to such “new” city will also be zero. (ATTACHMENT E) | Per Capita Estimate 2020 Atlanta Revenue $8,879,000 x 20.83% On a going-forward basis, the study area should expect its revenue from this source to decrease significantly. O.C.G.A. § 48-5C-1(c)(3) provides for a two-step distribution of Local Title Ad Valorem Tax Fee (“TAVT”) proceeds on a monthly basis. Over time, as annual ad valorem taxes phase out, the first step distribution will gradually increase, eventually comprising the majority of motor vehicle property taxes. Under the statutory structure, cities formed on or after January 1, 2013 will not receive a first-step distribution. Vehicles purchased on or after March 1, 2013 are subject to TAVT and are exempt from annual ad valorem tax. Thus, as Georgia taxpayers purchase new motor vehicles, the annual ad valorem tax revenue collected will decrease gradually each year.6 | $1,849,496 |
| 31.1340 – Intangibles (Regular and Recording) (OCGA §48-6-60 – Levied on intangible personal property.) | Per Capita Estimate 2020 Atlanta Revenue $7,969,000 x 20.83% | $1,659,943 |
Imposed upon the sale or consumption of goods and/or services, generally with few or limited exemptions. An example of a general sales tax is a tax on the retail price of all goods sold within a taxing jurisdiction, with the exception of food purchased for consumption off the premises.
| 31.3100 – Local Option Sales and Use Taxes (LOST) (Ga. Const., Art IX, §2, para 6; OCGA §48-8-3; OCGA §48-8-80—96) Levied on the purchase, sale, rental, storage, use, or consumption of tangible personal property and related services and are subject to voter approval. LOST funds collected at the point of sale are remitted to Georgia Department of Revenue and subsequently distributed to local governments based on LOST distribution certificates. Eleven Cities in Fulton County collect Local Option Sales Taxes (LOST) pursuant to an agreement with Fulton County which runs through 2022. However, should de-annexation occur, this would necessitate a re-negotiation of the LOST distribution with the newly formed City Government (ATTACHMENT F – 2020 ACCG Local Option Sales Tax (LOST) Renegotiation Guidebook). The 2020 LOST revenue received by the City of Atlanta was $110,710,000. Per capita estimate provided for budget purposes. | Per Capita Estimate 2020 Atlanta Revenue $ $110,770,000 (Reference Page 208 of Comprehensive Annual Financial Report (CAFR) x 20.83 | $23,073,348 |
Imposed on the sale, distribution or consumption of selected goods or services.
| 31.4100 – Hotel-Motel Excise Tax (OCGA §48-13-51 (a) 5.1 – (ATTACHMENT G) Levied for rooms, lodging, or accommodations furnished by hotels, motels, inns, tourist camps, tourist cabins, or any other place regularly furnishing rooms, lodgings, and accommodations. Every operator maintaining a business in the City of Atlanta renting guestrooms, must collect an 8% eight percent (DCA Hotel Motel Tax Report – ATTACHMENT H) tax of the amount paid by each occupant of a room with sleeping accommodations in a hotel, with the exception of permanent residents and government agencies. The occupant of any room(s) is liable for payment of this tax which is collected from the occupant by the hotel operator, acting as an agent for the City of Atlanta. To estimate the Hotel/Motel tax collections for the study area, the average occupancy rate, the number of hotel rooms, and the average cost of the stay must be estimated. To project a conservative estimate, average City of Atlanta values were used for occupancy rate and average hotel daily rate and applied to an estimated number of study area hotel rooms, though it is possible that average occupancy rates and daily rates may be more favorable in the study area compared with the City of Atlanta as a whole. | Per Capita Estimate The City of Atlanta forecast $63.9 million in City-wide Hotel/Motel taxes for FY 20211. $63.9 million x 20.83% will generate $13.31M. Based on review of the code and conversations with a Tourism Manager with the Georgia Department of Economic Development, 62.5% ($8.32M) of the projected income is restricted to promoting tourism, conventions and trade shows, and tourism product development. The balance is unrestricted and available to the newly formed City Government. | $4,991,389 To General Fund |
1 See Appendix C. City of Atlanta. (2021). City of Atlanta 2022 Budget. https://citycouncil.atlantaga.gov/home/showpublisheddocument/6465/637556318822070000
Revenues collected from businesses for the issuance of licenses and permits by the local government
| 32.1100 – Alcoholic Beverages Fees collected for the issuance of licenses relating to alcoholic sales. (OCGA §3-5-40—43; OCGA §3-5-40—43; OCGA §3-4-48; OCGA §3-6-21.3; OCGA §3-4-48; OCGA §3-6-60; OCGA §3-4- 130—133; OCGA §3-4-48; OCGA §3-6-60; OCGA §3-5-36 In order to sell alcoholic beverages in Georgia, a proprietor must have both a local and state license to sell either in packages or by the drink. Local licenses are renewed annually and each year’s renewal is accompanied by payment of a fee. | Per Capita Estimate 2020 Atlanta Revenue $9,035,000 x 20.83% Includes 32.1110 to 32.1180 in Amount | $1,881,991 |
| 32.1200 – General Business License Fees collected relating to general business licenses. OCGA §43-40-1; OCGA §33-8-1; OCGA §33-8-8; | Per Capita Estimate 2020 Atlanta Revenue $68,427,000 x 20.83%% Includes 32.1210 to 32.1900 in Amount | $14,253,344 |
| 32.2000 – Non-Business Licenses and Permits Revenues from all non-business licenses and permits levied according to the benefits presumably conferred by the license or permit. | Per Capita Estimate 2020 Atlanta Revenue $10,008,750 x 20.83% Includes 32.2200 to 32.2230 in Amount | $2,084,823 |
| 32.3100 – Building Structures and Equipment (Building Permits) Fees collected to help defray the cost of enforcing building codes. The fees may be classified by type of inspection as follows: (Ga. Const., Art IX, §2, para 3; OCGA Title 8, ch. 2; OCGA Title 36, ch. 13; OCGA §48-13-8—9) | Per Capita Estimate 2020 Atlanta Revenue $30,699,000 x 20.83% Includes 32.3110 to 32.3180 in Amount | $6,394,602 |
| 32.4000 – Penalties and Interest on Delinquent Licenses and Permits) Penalties for the payment of licenses and permits after their due date, and the interest charged on delinquent licenses and permits from their due date to the date of actual payment. | Per Capita Estimate 2020 Atlanta Revenue $1,966,000 x 20.83% Includes 32.4100 to 32.4590 in Amount | $409,518 |
Fees collected by local governments, generally for services provided. (Ga. Const., Art IX, §§2 and 3; OCGA §36-70-24.)
| 34.100 – Fees collected relating to general government operations. Miscellaneous fees for services. 34.1400 to 34.2200 – Conservative estimate for fees and services. | Per Capita Estimate 2020 Atlanta Revenue $22,175,000 x 20.83% Includes 32.4100 to 32.4590 in Amount | $3,880,000 |
Given the revenue estimates in Sections A to E, total annual revenues are estimated at $203.5 million. Many of these revenues can be expected to increase over time given inflationary pressure on the underlying cost-basis of the assets, goods or services the revenue is based on. In general, this estimate may be considered a 2021 estimate, with an expectation that revenues could be higher in future years.
| Revenue Category | Revenue Estimate |
| A. Real Property Taxes | $119,642,391 |
| Real Property – Public Utility and Other | $26,910,486 |
| B. Local Option Sales and Use Taxes (LOST) | $23,073,348 |
| C. Hotel/Motel Tax | $4,991,389 |
| D. Business Licenses and Permits | $25,024,278 |
| E. Miscellaneous Charges for Services | $3,880,000 |
| Total | $203,521,892.00 |
The expenditure estimates are based primarily on expenditures incurred by comparable governments. In calculating these estimates, CSGRI first established two primary comparable governments, the cities of Sandy Springs and Roswell. Both cities are located in the metro Atlanta area, have similar population, median household income, and poverty rates and are close in population to the study area. Profile data for the study area and the comparison cities is provided in the table below.
| Demographic Profile of Study Area and Primary Comparison Cities | |||
| Study Area | Sandy Springs | Roswell | |
| Population* | 103,867 | 108,080 | 92,833 |
| Median Income | $98,110 | $99,726 | $78,613 |
| Poverty % | 8.19% | 7.6% | 7.6% |
Buckhead City expenditures were estimated by calculating the per capita expenditures for each comparable city and multiplying the average by Buckhead City’s 2021 population. The study examined services typically provided by a city of the proposed city’s size. These costs only account for annual costs and do not estimate any startup expenses.
| Buckhead City Estimated Expenditures | |
| Mayor and Council | $395,733 |
| City Manager | $877,676 |
| City Clerk | $446,628 |
| Finance | $2,949,823 |
| City Attorney | $813,279 |
| Information Technology | $3,111,855 |
| Human Resources | $697,986 |
| Community Relations | $1,202,780 |
| Municipal Court | $1,425,055 |
| Police | $30,080,931 |
| Fire | $14,053,205 |
| Public Works | $20,666,417 |
| Parks & Recreation | $9,339,721 |
| Community Development | $3,860,736 |
| Total | $89,921,825 |
Roswell and Sandy Springs each have one mayor and six city council members. These officials are part-time city employees, and the amounts include salaries, benefits, and funds used for travel, education, and training.
| Total | Per Capita | |
| Sandy Springs FY 21 | $226,400 | $2.09 |
| Roswell FY 21 | $513,123 | $5.53 |
| Average Per Capita | $3.81 | |
| Buckhead City Estimate | $395,733 |
City Administration
The costs below capture expected expenses across the various administrative offices in the city. Each office receives funds for salaries, benefits, travel, training, and other operational costs, such as office supplies, communications, advertising, and technical services.
| Total | Per Capita | |
| Sandy Springs FY 21 | $872,395 | $8.07 |
| Roswell FY 21 | $818,565 | $8.82 |
| Average Per Capita | $8.45 | |
| Buckhead City Estimate | $877,676 |
| Total | Per Capita | |
| Sandy Springs FY 21 | $430,300 | $3.98 |
| Roswell FY 21 | $427,718 | $4.61 |
| Average Per Capita | $4.30 | |
| Buckhead City Estimate | $446,628 |
17
| Total | Per Capita | |
| Sandy Springs FY 21 | $2,308,300 | $21.36 |
| Roswell FY 21 | $3,288,900 | $35.43 |
| Average Per Capita | $28.40 | |
| Buckhead City Estimate | $2,949,823 |
| Total | Per Capita | |
| Sandy Springs FY 21 | $900,000 | $8.33 |
| Roswell FY 21 | $680,794 | $7.33 |
| Average Per Capita | $7.83 | |
| Buckhead City Estimate | $813,279 |
| Total | Per Capita | |
| Sandy Springs FY 21 | $2,565,700 | $23.74 |
| Roswell FY 21 | $3,357,993 | $36.17 |
| Average Per Capita | $29.96 | |
| Buckhead City Estimate | $3,111,855 |
| Total | Per Capita | |
| Sandy Springs FY 21 | $582,200 | $5.39 |
| Roswell FY 21 | $746,447 | $8.04 |
| Average Per Capita | $6.72 | |
| Buckhead City Estimate | $697,986 |
Community Relations expenditures, which include advertising and website management, are designated for communications and marketing. These costs include expenses related to salaries, benefits, and operations.
| Total | Per Capita | |
| Sandy Springs FY 21 | $1,626,150 | $15.05 |
| Roswell FY 21 | $752,241 | $8.10 |
| Average Per Capita | $11.58 | |
| Buckhead City Estimate | $1,202,780 |
Municipal Court expenditures capture salaries and benefits for the municipal judge and their staff as well as operating expenses for the court.
| Total | Per Capita | |
| Sandy Springs FY 21 | $1,392,000 | $12.88 |
| Roswell FY 21 | $1,351,526 | $14.56 |
| Average Per Capita | $13.72 | |
| Buckhead City Estimate | $1,425,055 |
This study deviates from the aforementioned methodology given the complexities of police budgeting. There is no universally accepted standard method for conducting a work-load assessment (Wilson & Weiss, 2014). Determining the number of police officers to employ comprises numerous variables to consider and include: the annual average of calls for service; arrests made; crime trends; variations in the types of and nature of crimes, frequency of and the intensity of the crime; response time of an officer to a call; time spent on the call on scene (total service time); number of officers needed per call (responding units); and the time necessary to follow-up writing the report (administrative time). Many crimes require additional follow-up through an investigation by detectives.
Common Reported Crime Trends for Buckhead City: 2009 to 2019
| Crime Type | Total | Annual Average |
| Part I Crimes | ||
| Aggravated Assault | 574 | 52 |
| Robbery-Pedestrian | 548 | 50 |
| Robbery-Commercial | 198 | 18 |
| Robbery-Residence | 65 | 6 |
| Homicide | 17 | 2 |
| Part II Crimes | ||
| Larceny From Vehicle | 10,885 | 990 |
| Larceny Non-Vehicle | 10,876 | 989 |
| Burglary-Residence | 2,209 | 201 |
| Auto Theft | 2,196 | 200 |
| Burglary Non-Residence | 783 | 71 |
Calls for service data and arrest trends were not available for analysis. However, crime statistical data reported by the Atlanta, GA Police Department on 10 categories of crime from 2009 through 2019 was accessed from the Cobra Report available on their website. The crime trends depicted in the table above do not represent all crimes occurring in Buckhead City. These reported crimes represent an annual average of 2,579 calls in which officers responded either through dispatch or were police-initiated.
The FBI (Crime in the US), annually reports crime occurrence and categorizes crimes as either violent (Part I) and property crimes (Part II). As depicted in the table on the previous page, Part II crimes represent the most reported crimes, accounting for about 95 percent of these reported crimes. The crimes of larceny from a vehicle and a larceny non-vehicle combined accounted for about 80 percent of the annual average reported property crimes, and occurred about three times daily. Burglary from a residence and from a non-residence accounted for annual average of about 11 percent of the property crimes. Auto-theft crimes accounted for about 9 percent of the property crimes.
Of the Part I crimes (Violent crimes) aggravated assaults and a robbery from a pedestrian accounted for about 26 percent of the reported violent crimes. Irrespective of the crime category, their occurrence reveals that criminals are likely to target their victims, target the location, and the risk for potential violence to a victim is high. Aggravated assaults and robbery crimes carry a high risk of harm to the victim.
These reported crimes in the above table do not account for all or other calls and incidents officers would provide response service. Beyond engaging in proactive patrols, responding to calls for service for crimes, law enforcement officers must also perform directed traffic enforcement functions, perform traffic stops, respond to traffic violations, and traffic accidents. Moreover, whenever fire personnel are dispatched to a fire, it is common for at least two patrol units to respond and provide traffic control functions.
Variations in the size of the population, geographic size of the municipality, and the diversity and variations in the type and number of businesses, residences, shopping centers, industry centers, schools, hospitals, parks and recreations, civic centers, and entertainment facilities, are important variables to consider and can impact crime trends and the need for law enforcement services. In contemporary societies police officers are also expected to actively engage in community policing strategies which comprise additional time to provide services. Law enforcement officers today must wear many hats and additional service duties can include: crisis intervener; family counselor; youth counselor; quell disturbances and disputes; search for missing children and the elderly; respond to calls involving the mentally impaired; protect citizens from natural disasters and protect those from self-inflicted injuries; and as a first responder, serve as society’s problem solver, to mention a few.
What is recognized is that the duties of law enforcement officers are multi-faced. Demands for police services ebb and flow across communities and response to calls or interactions with citizens vary by call, time of the call, and location of the call. Services provided by law enforcement officers fluctuates across the day of week, shift, time of the call or service provided, season of the year, and the nature of the community served.
The total number of law enforcement officers projected for this study is 250. In calculating the number officers needed, a blended approach was used by combing a per capita calculation and a potential workload assessment. Combing the two approaches provides a method for estimating the number of police officers that may be needed to adequately staff the police department.
First, the per capita calculation factors in the size of the population and the recommended number of officers per 1,000 residents. The Federal Bureau of Investigation (FBI, 2019) compiles staffing information from law enforcement agencies across the USA (Table 70). In their analysis, the FBI reports that police agencies in the Southern states of the US maintain an average ratio of 2.5 officers/1,000 residents in cities with populations between 100,000 to 249,999 residents. The population size of the Buckhead City is 103,867 residents. Therefore, it is estimated that 250 law enforcement officers (supervisors and patrol officers) would be needed. A majority of police agencies use this calculation method.
| Position/Rank | Number | Annual Salary (no benefits or retirement) |
| Chief | 1 | $150,000.00 |
| Deputy Chief | 4 | $100,000; $400,000.00 |
| Captain | 6 | $80,000; $480,000.00 |
| Lieutenant | 12 | $75,000.00; $900.00.00 |
| Sergeant | 30 | $65,000.00; 1,950,000.00 |
| Detective | 15 | $60,000.00; $900,000.00 |
| Patrol Officers | 175 | $55,000.00; 9,625,000.00 |
| Total | 250 | $14,405,000.00 |
The table above reveals that about 70 percent of the projected department personnel account for patrol officers. Command officers account for about 5 percent of the total and mid-level supervisors and detectives account for the remaining 25 percent. The police personnel budget would equal about $14,405,000.00.
Further, support personnel should also be considered. Potentially, about 18 clerical and administrative assistants would be needed to support the department. Using a salary average per person would amount to $40,000/person for an additional total of $720,000.00.
Moreover, the department should provide their own dispatch center. An allocation of about 10 dispatchers at a salary of $50,000.00/person would be needed. This estimated number would allow for a shift relief factor to accommodate days off, vacation and sick time, etc. The total estimated salary equals $500,000.00.
The total projected police department personnel including clerical and dispatchers budget would equal $15,625,000. Estimated benefits were calculated using the June 17, 2021 BLS report “Employer Costs for Employee Compensation – March 2021.” According to the report, salaries for state and local government employees account for 61.9 percent of employer costs and benefit costs account for the other 38.1 percent. Therefore, a reasonable approximation of benefits for the personnel above is $9,617,326. Additional variables to consider is the projected workload of department officers. Using a general guideline recommended by the International Association of Chiefs of Police (McCabe, 2013; Mccabe, 2017; Vose, Miller & Koshinen, 2020), the “Rule of 60” to determine the projected number of patrol officers is considered. Many existing police agencies employ about 65 to 70 percent of the force as patrol officers. In other words, at least two-thirds of the force should comprise patrol officers, which is the backbone of the department. Researching for the IACP, Wilson and Weiss (2014), and depending on the community, recommend that an officer’s time on shift should be spent on responding to calls for service, performing other police related activities (proactive policing, community engagement, etc.), and administrative duties.
The Rule also considers the response time of the call and the total service time to handle the call (officer minutes). There is no national standard which recommends an average response time to a call for service as there are innumerable variables to consider. Time spent on working and resolving the call has been examined. McCabe (2017) studied 68 police agencies for International City/County Management Association (ICCMA). He found that on average the Total Service Time devoted to resolving the call averaged about 48 minutes. Von, Miller, and Koskinen (2020) reported a slightly higher Total Service Time in their study and found the time to handle the call averaged about 72 minutes. This number included responding to the call for service, time on scene, and the time needed complete incident paper work. Taking an adjusted average, the total service time spent on handling a call should average about 55 minutes. Obviously, the total time necessary to handle the call may fluctuate and will be dependent upon the type of call, location, and severity of the call. Also, the time of day or night can also impact the total service time.
Police services must be provided 24-hours, 7-days a week, 365 days a year. Shift schedules generally are on 12-hour shifts, with rotating days off. Frequently, this is known as the Panama Plan and follows a 2-2-3 rotation (Amendola, et al., 2011). The plan provides for two-12 hour shifts and allows an officer every Friday, Saturday, and Sunday off, with two additional days off during the week. Potentially, patrol officers with supervisors could be separated into four squads to be schedule on shift while the other two are off, and vice versa, The 12-hour schedule could run from 6:00 am to 6:00 pm and includes 84 hours of work in a 2-week cycle. This type of shift schedule model accounts for a relief factor which would provide for days off, holidays, vacation time, sick days, court time, training days, and personal days. Allocating 175 patrol officers with the appropriate number of shift supervisors, would be sufficient to provide sufficient personnel to perform the necessary patrol functions.
Based on the population size, the nature of the types of crimes, the estimated calls for service, and the potential workload demand, it is estimated that allocating 250 law enforcement officers for the Buckhead City police department would sufficiently handle the projected number of calls for service and other duties needed to be performed. Lastly, other costs to consider for policing are the annual operating costs, which include those costs associated with training, supplies, and travel. Roswell’s operating budget in 2021 was $3,212,749 with 206 employees. Sandy Springs’ operating budget was $4,261,100 with 185 employees. Roswell’s operational cost was $15,595.87 per employee. Sandy Springs’ operating budget was $23,032.97 per employee. Using the average per employee cost ($19,314.42) for the proposed number of police personnel (250) results in an estimated operational cost $4,828,605.
The total estimated cost for police in the study area is $30,080,931.
References
Amendola KL, Weisburd D, Hamilton EE, Jones H, & Slipka M (2011). The shift length experiment: What we know about 8, 10, and 12-hour shifts in policing. Police Foundation, Washington, D.C., 1- 52; www.policefoundation.org/wp-content/uploads/2015/12/Shift-Length-Experiment-Practitioner- Guide.pdf.
Atlanta Georgia Police Department (2019). Crime statistics and crime data download: 2009 to 2019 (Cobra Report); www.atlantapd.org/i-want-to/crime-data-downloads.
Federal Bureau of Investigation (2019). Full-time law enforcement employees (Table 70). Crime in the United States, Department of Justice, Washington, D. C., www.fbi.gov/crime-in-the- u.s/2019/crime-in-the-u.s.-2019/tables/table-70.
Federal Bureau of Investigation (2019). Crime in the United States, Department of Justice, Washington, D.C.; https://www.fbi.gov/services/cjis/ucr/publications.
McCabe, JE & O’Connell PE (2017, November). Factors related to police staffing. International Journal of Humanities and Social Sciences Review, 3 (6): 1-14; www.digitalcommons.sacredheart.edu/cj_fac/23/.
McCabe J (2012). An analysis of police department staffing: How many officers do you really need?: A review of 62 police agencies analyzed by the ICMA/CPSM, 1-26, www.icma.org/sites/default/files/305747_Analysis%20of%20Police%20Department%20Staffing%20 _%20McCabe.pdf.
Vose BV, Miller M & Koskinen, S (2020, March). Law enforcement manpower analysis: An enhanced calculation model. Policing: An International Journal, 1-13.
Wilson JM, and Weiss A (2014). A performance-based approach to police staffing and allocation. United States Department of Justice, COPs, Washington, D.C., www.ojp.gov/ncjrs/virtual- library/abstracts/performance-based-approach-police-staffing-and-allocation.
These costs include salary, benefits, and operating costs for the proposed city’s fire and EMS. Sandy Springs has a separate line item for EMS. For simplicity, this study used Roswell’s approach and added EMS to the Fire budget.
| Total | Per Capita | |
| Sandy Springs FY 21 | $15,887,100 | $146.99 |
| Roswell FY21 | $11,474,267 | $123.60 |
| Average Per Capita | $135.30 | |
| Buckhead City Estimate | $14,053,205 |
Public Works is responsible for water systems, solid waste management, stormwater, and environmental services, as well as facility and fleet maintenance. The expenses cover salaries, benefits, and associated operating costs. Sandy Springs has separate line items for Facilities and Fleet Maintenance. These services were added to Public Works to make the comparison with Roswell more accurate.
| Total | Per Capita | |
| Sandy Springs FY 21 | $15,461,800 | $143.06 |
| Roswell FY 21 | $23,660,558 | $254.87 |
| Average Per Capita | $198.97 | |
| Buckhead City Estimate | $20,666,417 |
These costs are related to maintenance and operation of the parks and recreational facilities in the city. They include expenses related to salaries, benefits, and operational costs such as maintenance, repairs, and supplies.
| Total | Per Capita | |
| Sandy Springs FY 21 | $3,348,940 | $30.99 |
| Roswell FY 21 | $13,817,688 | $148.84 |
| Average Per Capita | $89.92 | |
| Buckhead City Estimate | $9,339,721 |
These costs are associated with planning, zoning, building, engineering, and code enforcement. The expenses include salaries, benefits, and operational expenses such as travel, supplies, and education.
| Total | Per Capita | |
| Sandy Springs FY 21 | $3,915,200 | $36.23 |
| Roswell FY 21 | $3,537,703 | $38.11 |
| Average Per Capita | $37.17 | |
| Buckhead City Estimate | $3,860,736 |
The report provides a feasibility analysis for the potential City of Buckhead. The report focuses on the revenue and expenditures of the potential new city and offers evidence based on currently available data on the fiscal viability of this new city. The report does not address other criteria that are also important to the new city including social, political, and governance issues. Valdosta State University and the Center for South Georgia Regional Impact do not provide any normative judgment on whether or not the City of Buckhead should incorporate; however, we state our findings with regard to the financial viability of the new city.
It is important to note the limitations of these types of studies. They cannot predict every possible variable that may occur in the future with a potential impact on the costs of government. Additionally, the study is not intended to be a model budget for a new city. A newly elected city council will endeavor to represent their constituencies and will have a set of priorities that may impact both taxing and spending patterns.
Based on our analysis, we find estimated revenues of $203.5 million exceed likely expenditures for the services identified to be provided, estimated at $89.8 million, and therefore have concluded that the City of Buckhead is likely fiscally feasible.
“Buckhead City” would be financially feasible in sheer revenue and expenditure terms — including with a new, larger police force — according to a university-conducted study legally required as part of the cityhood effort.
The feasibility report, released Sept. 13, allows state legislation to continue moving toward the local Buckhead City Committee’s goal of getting a binding cityhood question on the November 2022 ballot. The report estimates Buckhead City would have an annual budget surplus of around $113.6 million. But it cautiously notes that it does not endorse cityhood and does not address other financial and “social, political, and governance issues.”
“We’ve been saying all along that taxes paid to the City of Atlanta have not generated a fair return for Buckhead in terms of city services,” said Bill White, CEO of the BCC. “This feasibility study demonstrates that point inarguably, mathematically and once and for all. Given the same tax revenue, the administration of Buckhead City would deliver more and better services to the people of Buckhead, starting with a highly effective and properly compensated police force with a minimum of 250 officers.”
Committee for a United Atlanta, a group advocating for Buckhead to remain part of the city, did not immediately respond to a comment request.
With the study complete, the stage for political battle is set, which appears likely to clash along familiar lines these days: Republicans vs. Democrats and big business, and the governor vs. Atlanta. The study follows the BCC’s release of an internal poll of Buckhead residents showing around 61% in favor of holding a cityhood vote, but with a strong partisan divide on the issue.
In a BCC press release, the feasibility report was praised by the three state lawmakers who are shepherding the legislation in the General Assembly — all of them Republicans who do not represent Buckhead or Atlanta. They include Rep. Todd Jones of Cumming and Sens. Brandon Beach of Alpharetta and Clay Dixon of Buford, who is also one of the floor leaders for Gov. Brian Kemp, meaning he promotes legislation on Kemp’s behalf.
“There is now no question – and it is no surprise – that a Buckhead City would be financially feasible,” said Dixon. “People deserve to live without fear as they drive down the road or walk in a mall. The City of Atlanta has failed in epic proportions, and Buckhead has every right and reason to form a city with a strong police force and real leadership.”
“After reviewing the feasibility study, it is crystal clear that Buckhead City will help make the citizens of Buckhead safe and allow them more control of their own destiny in a fiscally responsible way,” said Beach.
“Self-governance is a bedrock principle of our republic,” said Jones. “The residents of the proposed Buckhead City should be given the opportunity in November 2022 to vote on incorporation.”
For a full copy of the report, click here.
Under Georgia law, the General Assembly cannot consider legislation about the incorporation of a new city unless a study shows it to be financially possible based on the tax base and comparisons with other local cities. Several prominent universities that typically do such studies, including the University of Georgia, declined to perform the Buckhead City study, mostly for undisclosed reasons, though UGA said it was too busy. The BCC finally got it done by the Center for South Georgia Regional Impact at Valdosta State University, which, as the name suggests, does not usually study Atlanta issues.
Titled the “Fiscal Feasibility Analysis of a Proposed Buckhead City,” the report is solely focused on estimated revenues and expenditures. By that measure, the center’s staff “have concluded that the City of Buckhead [sic] is likely fiscally feasible,” the report says.
The report offers no opinion for or against cityhood. And, its text adds,
The report does not address other criteria that are also important to the new city[,] including social, political, and governance issues.”
“It is important to note the limitations of these types of studies,” the report further cautions. “They cannot predict every possible variable that may occur in the future with a potential impact on the costs of government. Additionally, the study is not intended to be a model budget for a new city. A newly elected city council will endeavor to represent their constituencies and will have a set of priorities that may impact both taxing and spending patterns.”
Another side note in the report is that the formation of a new city would require a renegotiation of the distribution of Fulton County’s local special option sales tax revenues to cities.
With all those caveats, here’s the report’s estimates — which it says are conservative on revenue and high for expenditures:
“Subsequently, Buckhead City could offer property owners a significant reduction in property taxes, enhanced and/or new services for city residents, or a combination thereof,” the report says.

One asterisk in the report: “These costs only account for annual costs and do not estimate any startup expenses.”
One asterisk not in the report is that the new city or its citizens likely would be paying for other services outside of traditional medium-city departments. The BCC said in a press release that it intends to keep using the Atlanta Public Schools system and the City of Atlanta water and trash collection, among other services.
The estimates were based on current property valuations and “applicable millage rates,” and comparison with the budgets of Fulton County and the cities of Atlanta, Brookhaven, Roswell, Sandy Springs and South Fulton. Roswell and Sandy Springs — which are similar in size to the proposed Buckhead City — were specifically used for expenditure estimates. The estimates were made by calculating the two cities’ per-capita spending and multiplying the average by Buckhead’s 2021 population and applying it to services “typically” provided by such cities.

Police department spending is an important and relatively detailed part of the report, and is also politically important, as crime concern is the primary driver of cityhood separatism. The specific proposal analyzed is a 250-member police force with patrol officers’ pay set at $55,000 a year — which would be more officers and higher basic pay than the Atlanta Police Department offers Buckhead today.
The report says that police budgeting is so complex with many variables that the analysis “deviates” from typical estimation methods. It settled on a “a blended approach” combining per-capita spending and “potential workload assessment.”
The police budget estimate totals $20,080,931. Of that, $14.405 million is police salaries, not including benefits or retirement.
The estimates for some other city departments include:

Buckhead City would be roughly 25 square miles and have a population around 103,867, according to the report. That makes it roughly 20% of the City of Atlanta by population, land area and number of parcels, the report says.
A major concern of cityhood opponents is the financial consequence to the rest of Atlanta. The BCC claims — though the report does not mention or support this — that the removal of Buckhead would balance out for Atlanta. “Any reduction in funds to the City of Atlanta due to the formation of Buckhead City will be offset by the reduction of responsibility for police, roads and parks,” says the BCC website. “A smaller Atlanta … a smaller anything … is easier to manage.”